

Observability - A Beginner Guide


Observability – About all the hype in the industry

Observability is a term that has been gaining extreme popularity in the industry today. It is becoming one of the key experience components for the majority of senior technical positions. Every large-scale internet organisation today has some observability infrastructure in place to make sure its systems are well-monitored and problems are easily traceable. I am writing this article primarily for the people who are completely new in this observability space and want to get the basics clear to get started.
The article tries to capture the keywords used on a daily basis, explains the significance of each task done as part of observability, and puts forth the challenges that exist in the industry today around observability. I’ll try to put this in the form of a problem-solution approach so that it is absolutely clear.
Observability – The need of the day
Before we dive in the basics, let us understand why is observability so important. For understanding the same, I have laid out a scenario below.
A company Rapid Runner Inc has built an application that provides you with an online gaming platform where you can play a game with real players. The services are deployed on extremely powerful servers with 64GB of RAM, Crazy fast CPU and 16 GB of GPU (if you do not understand how this impacts – just think “large and fast servers”). However, once the website went live and traffic started going up, some users started complaining that they were unable to start game. Some of the users noticed video lag/stickiness. Imagine – What could be done here?
The above scenario is absolutely hypothetical – However, it depicts real life problems that companies face on a regular basis. There are several problems here:
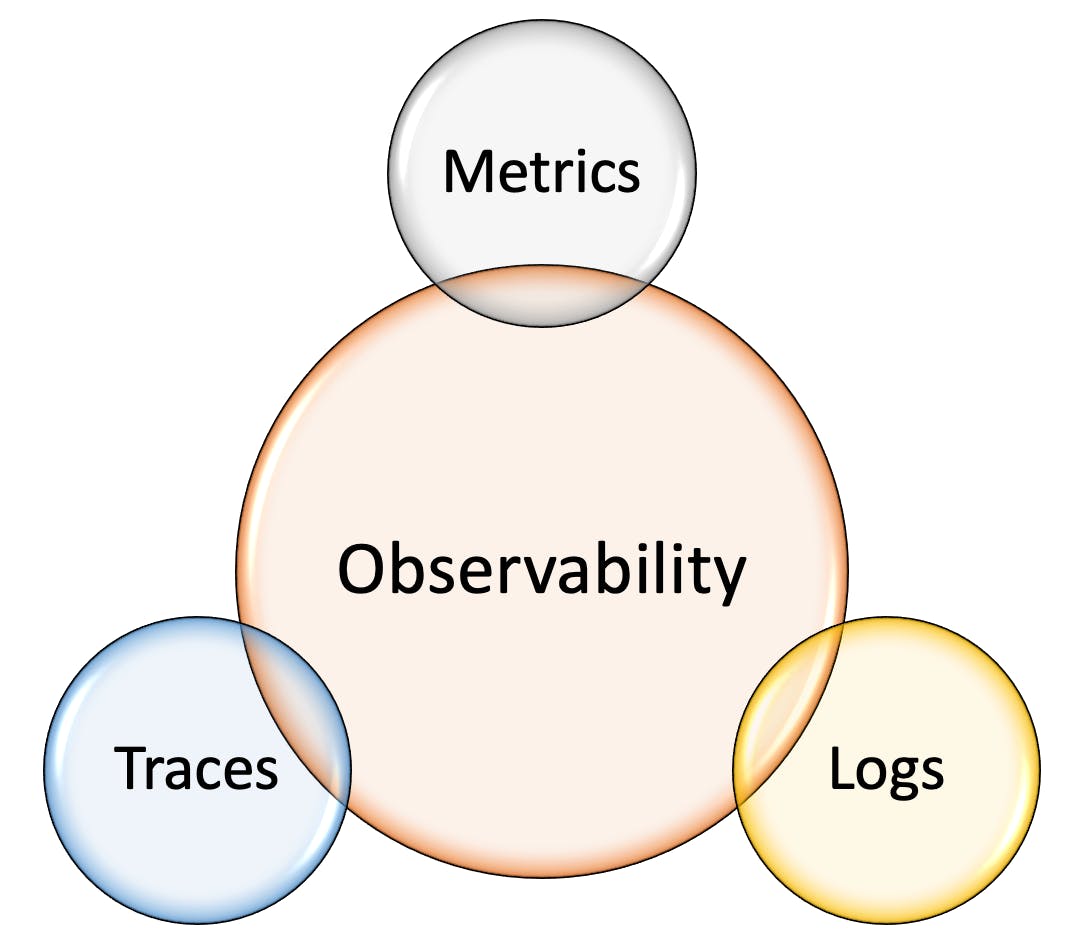
How to track what caused API failure? How to track the exact cause of latency for the video service? How to know if servers are enough powerful or not? How do we prepare ourselves for further rising traffic? These are the kind of problems that are answered by Observability solutions like Logging, Tracing and Metrics monitoring. These are the three primary concepts we would discuss further in the document
The basic observability – Application and Access Logs
For a small-scale to a medium-scale organization with a smaller application footprint, applications logs are most of the time the first place to look at for errors. Application and access logs, if elaborate, can exactly pinpoint the piece of code that is causing errors. As a beginner, you might ask – What are Logs?
Every application, as they run, generates text content written to standard out or files. This text content is the required description of what is running inside the code. A log file basically contains the information like a function that is being executed, specific steps that are completed in the programming, the details of users/entity that is being worked on, and the errors that get encountered. Here’s a sample log from an Apache Web server:
111.222.333.123 HOME - [01/Feb/1998:01:08:39 -0800] "GET /bannerad/ad.htm HTTP/1.0" 200 198 "referrer.com/bannerad/ba_intro.htm" "Mozilla/4.01 (Macintosh; I; PPC)" 111.222.333.123 HOME - [01/Feb/1998:01:08:46 -0800] "GET /bannerad/ad.htm HTTP/1.0" 200 28083 "referrer.com/bannerad/ba_intro.htm" "Mozilla/4.01 (Macintosh; I; PPC)" 111.222.333.123 AWAY - [01/Feb/1998:01:08:53 -0800] "GET /bannerad/ad7.gif HTTP/1.0" 200 9332 "referrer.com/bannerad/ba_ad.htm" "Mozilla/4.01 (Macintosh; I; PPC)" 111.222.333.123 AWAY - [01/Feb/1998:01:09:14 -0800] "GET /bannerad/click.htm HTTP/1.0" 200 207 "referrer.com/bannerad/menu.htm" "Mozilla/4.01 (Macintosh; I; PPC)"
Notice how it contains timestamped lines of text that provide information about the user browser, IP address, URL requested, and a few other entities. Log files like this help us analyse which request faced an error and get the exact timing of the request too. However, as the audience for applications grows, the size of these log files grows too. It goes up to 1GB per day at times – So how do we analyse these log files? Here are some tools that we leverage to ingest and analyse logs.
Metrics – Observing the system health
Metrics are a measurement of how any system, application or service is doing. Once the systems reach a high volume threshold, they need to be constantly monitored for any errors/warnings. For instance, CPU orders climbing close to 100 constantly could lead to a crash or a high number of requests from a particular IP address could lead to a DDoS attack. Events like this need to be predicted as anomalies and alerts need to be raised. This is where metrics monitors come into play.
Metrics can be gathered by two mechanisms:
Push-based metrics collection: In this method, metrics are sent to the receiver by the application/system itself. A metrics exporter or an SDK is used to publish the metrics to the receiver.
Pull-based metrics collection: In this method, the receiver scrapes pre-configured URLs for collecting metrics data. This collection happens at pre-defined intervals.
The gathered metrics are further stored for analysis. The metrics can be stored in a time-series database, object storage as a CSV, or other data storage backends. Metrics can be used to further plot graphs and create alerts to notify the developers/SRE team.
Conclusion
Observability is a broad scope of work in modern IT systems. It is key to maintaining uptimes of five 9s nature. Understanding the concepts of observability as a developer helps you understand how you could monitor the state of your system better. Feel free to comment in case you need more clarification on any of the terminologies. Happy to help!